
With China’s DeepSeek pressuring investors to take a closer look at the current environment of artificial intelligence (AI) development within the U.S., some are taking a moment to question the accuracy of a much larger idea — American Exceptionalism. Ever since the end of the world wars, international leaders have acknowledged the “exorbitant privilege” the U.S. has with its de facto global reserve currency. With great privilege comes great responsibility. In this piece, we discuss the factors that define U.S. exceptionalism with its implications.
Catalyst for Market Volatility
The Chinese firm, DeepSeek, has created a catalyst for volatility in recent days, so how should investors think about this piece of news? The Chinese AI firm created a publicly available open-source platform that seemed to supplant domestic leadership in AI development. Perhaps America’s place at the forefront of technological innovation is over; however, it may be premature to address that concern. The LPL Research team published a blog on the topic recently: “DeepSeek: What Happened and What Are Possible Implications?”
Over the last two years, America has been leading the way in AI. American companies have created large language models, developed better technology in the form of stronger graphics processing units (GPUs), and implemented AI products in preexisting services. Domestic innovation continues to rise to new heights as the U.S. has long been a leader in technological advancements, thanks to substantial investments in research and development (R&D), a robust higher education system, and a dynamic entrepreneurial ecosystem.
U.S. Innovation Continues to Rise
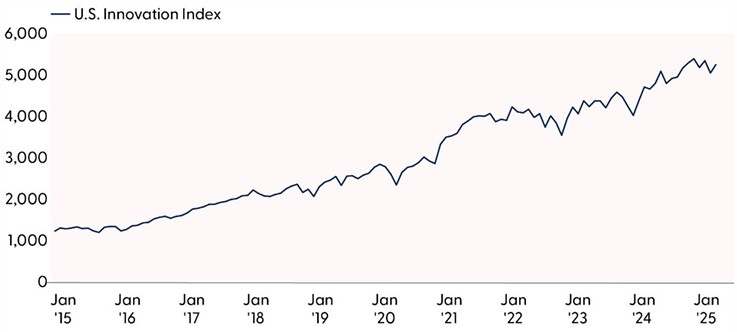
Source: LPL Research, Bloomberg, 01/30/25
Disclosures: All indexes are unmanaged and can’t be invested directly. Past performance is no guarantee of future results. The Bloomberg Innovation Index includes R&D expenditure as a percentage of gross domestic product (GDP), manufacturing value-added per capita, number of domestic high-tech public companies as a share of world’s total high-tech public companies, postsecondary education, the research job market, and patent filings.
The arrival of a competitor’s product that is seemingly just as good but free to the consumer and cheaper to produce, has challenged the idea that America will lead the way in further developments. But in recent days, we have learned more of the safety and security concerns surrounding the free, open-sourced chatbot. Not to mention the questionable data collection practices and potential vulnerabilities in DeepSeek’s infrastructure.
Aside from DeepSeek and questions about America’s ability to innovate, U.S. exceptionalism is partially based on the dollar’s de facto status as the world’s reserve currency. Dating back to the immediate aftermath of the Second World War, rivals have been attempting to undermine the dollar. Allies have also complained about the advantages America receives from its status, with de Gaulle’s government decrying America’s “exorbitant position” in international finance.
Global Payments by Currency
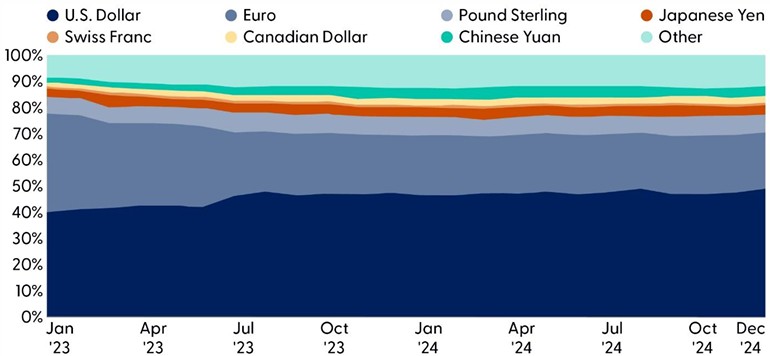
Source: LPL Research, SWIFT, 01/30/25
Disclosures: Past performance is no guarantee of future results.
The modern extension of these frustrations can be seen in the actions of Russia and China as they seek to provide their own currencies as alternatives to the dollar. However, with the dollar being used in nearly half of global transactions, its status is safe as the world’s reserve currency and will continue to buttress the idea of American Exceptionalism.
A dominant currency is an important factor in trade negotiations. As investors anticipate the effects of tariffs on trade relations, business planning, and consumer prices, they should remember the currency responses throughout 2017 and 2018 during the previous Trump tariffs. Dollar appreciation should offset some of the impacts as research from the National Bureau of Economic Research (NBER) showed.1
1To What Extent Are Tariffs Offset By Exchange Rates? | NBER
In fact, a stronger dollar along with a weaker yuan absorbed a fair amount of the impact during the previous administration’s trade policies.
Recent GDP growth and stock market performance also support the idea of American Exceptionalism. Through the recovery from the COVID-19 pandemic and the subsequent period of rising inflation, America fared much better than other developed nations. America experienced greater GDP growth than its peers, such as the United Kingdom, leading Eurozone economies, and Japan. In addition to consistent GDP growth, America’s stock markets continued to perform well. The S&P 500 outperformed leading indexes from the United Kingdom, the Eurozone, Japan, and China over the last two years and as of the end of 2024, America represents approximately 50% of the world’s equity market cap.
U.S. Stocks as a Percentage of World Market Cap

Source: LPL Research, Bloomberg, 01/30/25
Disclosures: All indexes are unmanaged and can’t be invested directly. Past performance is no guarantee of future results.
Conclusion
U.S. exceptionalism remains for several fundamental reasons. The dollar maintains its status as the world’s reserve currency. Despite attempts by rivals and complaints from allies, the dollar remains dominant, used in nearly half of global transactions. The role of domestic markets also helps define exceptionalism. As of early 2025, the total market capitalization of the U.S. stock market was approximately $62.2 trillion. The global stock market’s total market capitalization was around $116 trillion, which means the U.S. market cap represents over half of the world’s total market capitalization.
The new approach to AI likely does not jeopardize the bull market, as broader market participation and Federal Reserve rate cuts are likely to act as tailwinds. From a technical perspective, the S&P 500 remains near record-high territory amid improving market breadth and momentum. Technical damage within the heavy-weight tech sector has been minimal as buyers stepped up near support from the mid-January lows. Despite the January 27 pullback, sector breadth is also holding up relatively well, with the majority of tech stocks trading above their 200-day moving average. However, technical damage has been more pronounced on a relative basis, as the tech sector vs. S&P 500 ratio chart recently dropped to multi-month lows.
Of course, with great privilege comes great responsibility.
Important Disclosures
This material is for general information only and is not intended to provide specific advice or recommendations for any individual. There is no assurance that the views or strategies discussed are suitable for all investors or will yield positive outcomes. Investing involves risks including possible loss of principal. Any economic forecasts set forth may not develop as predicted and are subject to change.
References to markets, asset classes, and sectors are generally regarding the corresponding market index. Indexes are unmanaged statistical composites and cannot be invested into directly. Index performance is not indicative of the performance of any investment and do not reflect fees, expenses, or sales charges. All performance referenced is historical and is no guarantee of future results.
Any company names noted herein are for educational purposes only and not an indication of trading intent or a solicitation of their products or services. LPL Financial doesn’t provide research on individual equities.
All information is believed to be from reliable sources; however, LPL Financial makes no representation as to its completeness or accuracy.
All investing involves risk, including possible loss of principal.
US Treasuries may be considered “safe haven” investments but do carry some degree of risk including interest rate, credit, and market risk. Bonds are subject to market and interest rate risk if sold prior to maturity. Bond values will decline as interest rates rise and bonds are subject to availability and change in price.
The Standard & Poor’s 500 Index (S&P500) is a capitalization-weighted index of 500 stocks designed to measure performance of the broad domestic economy through changes in the aggregate market value of 500 stocks representing all major industries.
The PE ratio (price-to-earnings ratio) is a measure of the price paid for a share relative to the annual net income or profit earned by the firm per share. It is a financial ratio used for valuation: a higher PE ratio means that investors are paying more for each unit of net income, so the stock is more expensive compared to one with lower PE ratio.
Earnings per share (EPS) is the portion of a company’s profit allocated to each outstanding share of common stock. EPS serves as an indicator of a company’s profitability. Earnings per share is generally considered to be the single most important variable in determining a share’s price. It is also a major component used to calculate the price-to-earnings valuation ratio.
All index data from FactSet or Bloomberg.
This research material has been prepared by LPL Financial LLC.
Not Insured by FDIC/NCUA or Any Other Government Agency | Not Bank/Credit Union Guaranteed | Not Bank/Credit Union Deposits or Obligations | May Lose Value
For public use.
Member FINRA/SIPC.
RES-0002850-0125 Tracking #690968 | #690969 (Exp. 02/26)