
Volatility has come back into the market as the narrative shifted toward a higher-for longer monetary policy backdrop. Signs of sticky inflation and a resilient economy, including a strong labor market, have underpinned the change in expectations. Yields have reacted by rerating significantly higher this month, while stocks have pulled back from overbought conditions. Technical damage is beginning to mount on the S&P 500, but its longer-term uptrend remains intact. The U.S. dollar has followed yields higher, creating headwinds for U.S. multinationals and currency stability headaches for other central banks.
CHANGING NARRATIVES
Wall Street narratives can change relatively quickly as investors translate new information into speculation over future events. One of the widely publicized narratives at the beginning of the year was the ‘Goldilocks’ economy. This theme was used to describe an ideal economic state, where inflation is not too hot and growth is not too cold, analogous to the porridge that was “just right” in the popular Goldilocks and the Three Bears children’s story. Stocks tend to do well against this backdrop, evidenced by the S&P 500’s 10.2% price gain in the first quarter — a rally that also included 22 record highs and a maximum drawdown of only 1.7%.
On Main Street, narratives often change with the seasons. I was reminded of this when watching snowfall quickly turn into rain during a volatile week of weather in the Midwest. Inevitably, as the narrative goes, April showers bring May flowers, at least that is the hope. With markets, hotter than-expected inflation data underpinned a volatile few weeks of price action and delivered the proverbial April showers, driving the S&P 500 down 5.5% this month, as of April 19.
Akin to spring, there is also hope for May flowers blooming in the form of a market rebound. However, the timing and likelihood of a recovery in stocks could largely be predicated on how the market handles incoming inflation data, including the upcoming personal consumption expenditures (PCE) report on Friday — the Federal Reserve’s (Fed) preferred measure of inflation. Another upside inflation surprise would feed right into the market’s recently rejuvenated “higher for longer” narrative, underpinned by rising expectations for the Fed to keep interest rates elevated for a prolonged period (and by default, reduced expectations for interest rate cuts).
The chart below highlights how the market has shifted toward the higher-for-longer monetary policy outlook. At the start of the year, fed funds futures forecasted six or seven rate cuts by year-end, expectations LPL Research considered too high at the time. Resilient economic data, especially in the labor market, coupled with three straight months of hotter-than-expected consumer inflation data significantly reduced rate cut estimates to one or maybe two by year-end (odds for a second cut are running near 50%). You may also notice how the market has now become less dovish than even the Fed, which forecasted three rate cuts during its March policy meeting.
THE MARKET HAS SIGNIFICANTLY REDUCED RATE CUT EXPECTATIONS THIS YEAR
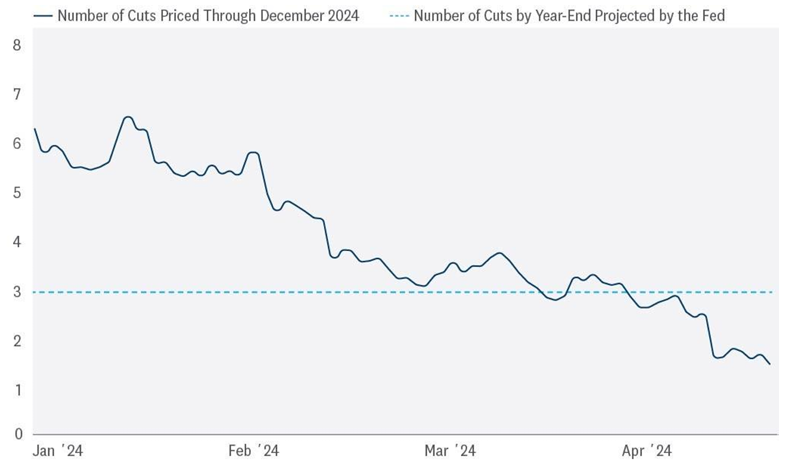
Source: LPL Research, Bloomberg 04/18/24
Past performance is no guarantee of future results.
WHAT DOES HIGHER FOR LONGER MEAN FOR YIELDS?
Treasury yields are inversely related to rate cut expectations. As the market repriced the probability of the Fed keeping things on hold for longer than originally anticipated, yields jumped higher across the curve. The closely watched 10-year Treasury yield surged over 40 basis points this month to around 4.60%, a far cry from the 3.88% starting point of the year. Technically, yields have also broken out above key resistance near 4.35%, a level tracing back to the October 2022 highs and a tipping point for risk appetite last summer. And while today’s price action shares some parallels to then — surging Treasury yields contributed to selling pressure in an overbought equity market — stocks have thus far absorbed the recent jump in rates much better. This is demonstrated by a less negative correlation between the S&P 500 and 10-year Treasury yields between now and then, suggesting markets may be a little more comfortable in the economy handling higher rates this time around.
THE BREAKOUT IN YIELDS APPEARED TO BE THE TIPPING POINT FOR RISK APPETITE
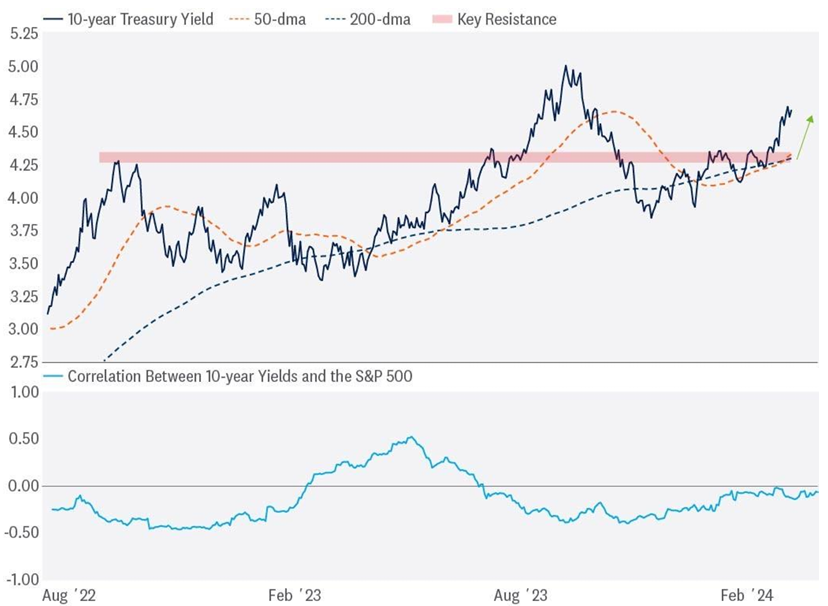
Source: LPL Research, Bloomberg 04/18/24
All indexes are unmanaged and cannot be invested in directly. Past performance is no guarantee of future results.
There is also some relatively good news embedded in the jump in yields, as most of the increase can be attributed to growth expectations outpacing inflation expectations, assuaging some fears over stagflation. The other good news is that the current backup in rates provides opportunities for investors to lock in high-quality fixed income yields at attractive levels. As a reminder, LPL Research continues to recommend a modest overweight to fixed income, funded from cash.
WHAT DOES HIGHER FOR LONGER MEAN FOR STOCKS?
Overbought conditions often leave investors searching for reasons why the market needs to sell off. The shift to higher-for-longer monetary policy serves as a compelling excuse for reduced risk appetite, especially when paired with hot inflation data, hawkish Fedspeak, surging yields, and headlines of a war escalating further in the Middle East. Technically, the S&P 500 has pulled back through a shorter-term uptrend and violated its 20- and 50-day moving averages (dma).
Oversold conditions have subsequently developed, evidenced by over half of the index registering new four-week lows last week. Historically, crossovers above the 50% threshold have often been found at relief rally inflection points, especially when the market is holding above its longer-term trend. Regarding downside risk, a correction (technically, at least a 10% drawdown, but not beyond 20%) is not out of the cards — and completely normal within a bull market. However, from a technical perspective, we continue to view 4,800 as a worst-case scenario for the S&P 500. Confidence for a relatively shallow drawdown is supported by no change in leadership away from cyclical/offensive sectors, bullish market breadth that is holding up relatively well, longer-term momentum implications of this rally, historically tight credit conditions, and resilient economic data.
TECHNICAL DAMAGE IS BEGINNING TO MOUNT
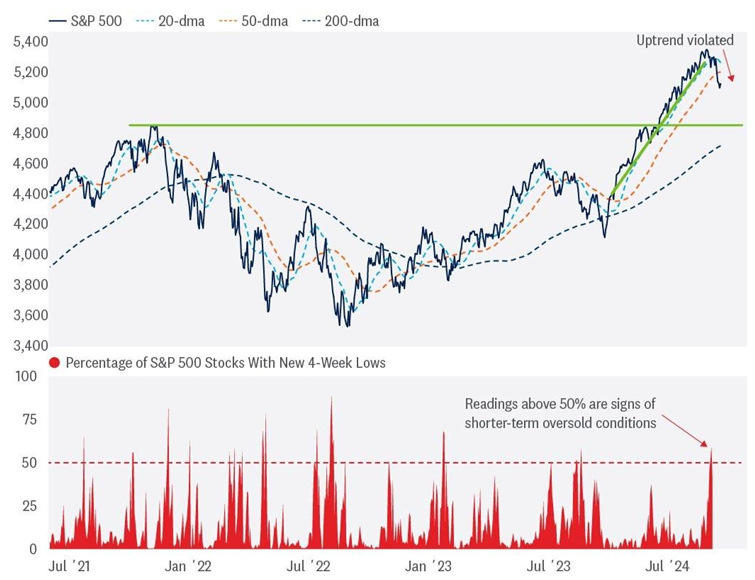
Source: LPL Research, Bloomberg 04/18/24
All indexes are unmanaged and cannot be invested in directly. Past performance is no guarantee of future results.
DON’T FORGET ABOUT THE DOLLAR
The U.S. dollar has rerated higher amid the shift toward higher-for-longer monetary policy. Momentum in the greenback suggests a retest of the 2023 highs could be underway. And while a stronger dollar creates headwinds for U.S. multinational companies generating revenues abroad, it can also create headaches for other central banks.
In currency markets, it is always a relative game, and a stronger dollar equates to a cheaper currency abroad. When other foreign currencies become too cheap, central banks sometimes have to intervene and prop up their own currencies. This can be costly, detract from hard dollar currency reserves, and if not managed properly, weigh on credit risk as it could materially impact a country’s ability to service its dollar-denominated debt. Emerging markets are often a victim of a stronger dollar and more recently, the People’s Bank of China (PBOC) has struggled to maintain yuan stability against the dollar, forcing it to weaken its daily reference rate. China is also not only export-driven but is also tasked with trying to stimulate its struggling economy, leaving aggressive tightening as a problematic option for the PBOC. The Bank of Japan (BOJ) is also struggling with a weaker yen, prompting speculation for forced intervention and/or a potential earlier-than-expected rate hike.
KING DOLLAR REMAINS ON THE THRONE
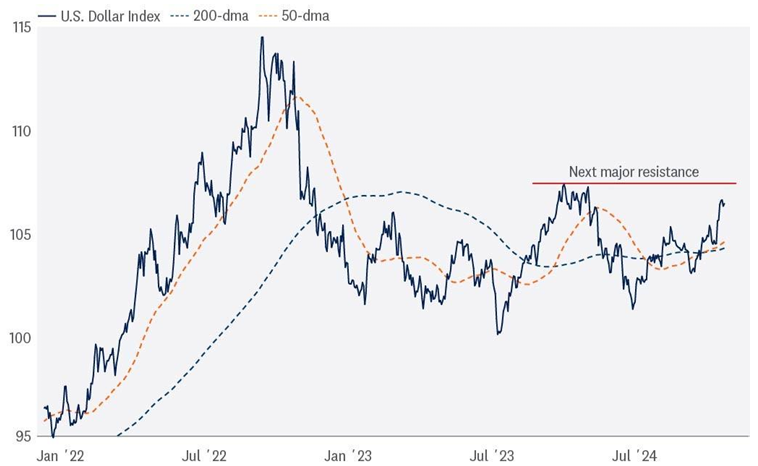
Source: LPL Research, Bloomberg 04/18/24
All indexes are unmanaged and cannot be invested in directly. Past performance is no guarantee of future results.
CONCLUSION
The shift toward higher-for-longer monetary policy has contributed to recent selling pressure in an overbought equity market. Treasury yields have rerated higher, but the increase can be attributed more to growth expectations outpacing inflation expectations. We also view the backup in rates as an opportunity for investors to lock in elevated high-quality fixed income yields. Dollar dominance has been another derivative of the higher-for-longer narrative, creating currency stability risk, especially for emerging markets.
Finally, it is important to remember pullbacks and even corrections are completely normal within a bull market. They provide an opportunity for fundamentals to catch up with price, reset overbought conditions, suppress overly exuberant sentiment, and provide another potential entry point into this bull market.
TACTICAL ASSET ALLOCATION INSIGHTS
LPL’s Strategic and Tactical Asset Allocation Committee (STAAC) maintains its neutral equities stance tactically. The improved economic and earnings outlook this year has kept the risk-reward trade-off for stocks and bonds fairly well balanced, perhaps with a slight edge to bonds over stocks currently. Recent stubbornly high inflation readings may delay Fed rate cuts and limit the upside to stock prices over the balance of the year, although two or possibly three cuts may still come by year-end.
Within equities, on a tactical basis, the STAAC continues to favor a tilt toward domestic over international equities, with a preference for Japan among developed markets, and an underweight position in emerging markets (EM). The Committee recommends a very modest tilt toward the growth style after reducing its overweight position in mid-March, in favor of adding small caps to remove that underweight position. Energy remains a favored sector, along with communication services. Finally, the STAAC continues to recommend a modest overweight to fixed income, funded from cash.
IMPORTANT DISCLOSURES
This material is for general information only and is not intended to provide specific advice or recommendations for any individual. There is no assurance that the views or strategies discussed are suitable for all investors or will yield positive outcomes. Investing involves risks including possible loss of principal. Any economic forecasts set forth may not develop as predicted and are subject to change.
References to markets, asset classes, and sectors are generally regarding the corresponding market index. Indexes are unmanaged statistical composites and cannot be invested into directly. Index performance is not indicative of the performance of any investment and do not reflect fees, expenses, or sales charges. All performance referenced is historical and is no guarantee of future results.
Any company names noted herein are for educational purposes only and not an indication of trading intent or a solicitation of their products or services. LPL Financial doesn’t provide research on individual equities.
All information is believed to be from reliable sources; however, LPL Financial makes no representation as to its completeness or accuracy.
US Treasuries may be considered “safe haven” investments but do carry some degree of risk including interest rate, credit, and market risk. Bonds are subject to market and interest rate risk if sold prior to maturity. Bond values will decline as interest rates rise and bonds are subject to availability and change in price.
The Standard & Poor’s 500 Index (S&P500) is a capitalization-weighted index of 500 stocks designed to measure performance of the broad domestic economy through changes in the aggregate market value of 500 stocks representing all major industries.
The PE ratio (price-to-earnings ratio) is a measure of the price paid for a share relative to the annual net income or profit earned by the firm per share. It is a financial ratio used for valuation: a higher PE ratio means that investors are paying more for each unit of net income, so the stock is more expensive compared to one with lower PE ratio.
Earnings per share (EPS) is the portion of a company’s profit allocated to each outstanding share of common stock. EPS serves as an indicator of a company’s profitability. Earnings per share is generally considered to be the single most important variable in determining a share’s price. It is also a major component used to calculate the price-to-earnings valuation ratio.
All index data from FactSet.
Value investments can perform differently from the market as a whole. They can remain undervalued by the market for long periods of time.
The prices of small cap stocks are generally more volatile than large cap stocks.
International investing involves special risks such as currency fluctuation and political instability and may not be suitable for all investors. These risks are often heightened for investments in emerging markets.
LPL Financial does not provide investment banking services and does not engage in initial public offerings or merger and acquisition activities.
This research material has been prepared by LPL Financial LLC.
Securities and advisory services offered through LPL Financial (LPL), a registered investment advisor and broker-dealer (member FINRA/SIPC). Insurance products are offered through LPL or its licensed affiliates. To the extent you are receiving investment advice from a separately registered independent investment advisor that is not an LPL affiliate, please note LPL makes no representation with respect to such entity.
Not Insured by FDIC/NCUA or Any Other Government Agency | Not Bank/Credit Union Deposits or Obligations | Not Bank/Credit Union Guaranteed | May Lose Value
RES-0001000-0324 | For Public Use | Tracking #568609 (Exp. 04/2025)