
As the stock market recovered from the 2020 pandemic lows, valuations reached levels not seen since the dotcom bubble more than 20 years ago. The reopening economy and massive fiscal stimulus helped fuel one of the strongest starts to a bull market ever (a bull market that just turned two-years-old last week). Low interest rates were a big part of the story. But just as low interest rates helped support stock valuations, that relationship can go in reverse as we’ve witnessed recently.
Resilient Performance
Stocks have been dealt a tough hand in 2022.
- Inflation is the highest it’s been in 40 years and has not likely peaked.
- The Federal Reserve (Fed) is becoming more aggressive than markets had originally anticipated.
- Russia is posing a significant and sustained geopolitical threat.
- Fears of China military aggression in Taiwan have become more widespread.
Yet, despite these challenges, the S&P 500 Index is only down about 5% year to date following its latest rebound. We won’t declare victory yet, but in our view, the markets are still holding up.
The fundamentals remain mostly positive. We still expect above-trend U.S. economic growth this year, bolstered by consumers flush with cash and the strong job market. Persistent inflation has increased the risk that Fed rate hikes could send the economy into recession in the next year or two, but that is still not our base case. We see inflation starting to come down over the next few months as supply chain issues are further resolved, labor supply potentially comes back and helps ease wage pressures, and (we pray) a ceasefire in Ukraine and eventual peaceful resolution to the conflict may help bring commodity prices down.
Meanwhile, Corporate America is in excellent shape—earnings estimates are higher in 2022 now than they were at the start of the year, which is no small feat. And high inflation has brought pricing power to many companies along with more revenue for commodity producers. This is evident in the double-digit revenue growth S&P 500 companies are expected to produce in first quarter 2022 earnings season (source: FactSet).
Despite this generally favorable fundamental picture, we recognize stocks are garnering less valuation support from interest rates. Our outlook remains optimistic, and we continue to recommend investors overweight equities relative to their targets, but with less valuation support against an increasingly challenging macroeconomic backdrop, a slightly more cautious stance seems appropriate at this time.
Interest rates and stocks are tightly connected
This positive outlook is not without risks, particularly around the Fed’s inflation fight. We saw in 2018 what can happen when the market thinks the central bank is getting too aggressive—a 19% correction for the S&P 500 during that year’s fourth quarter. And certainly we would not dismiss the potential for an escalation of the war in Europe and a broader conflict.
That said, higher interest rates are the primary reason why we now see a lower fair value for the S&P 500 at yearend. Higher interest rates tend to correspond to lower valuations, as shown in [Figure 1], which plots 60 years of data comparing the S&P 500’s price-to-earnings ratio (P/E) relative to 10-year Treasury yields. Each dot on the scatterplot charts represents the P/E and interest rate at a given point in time. The relationship is clear.
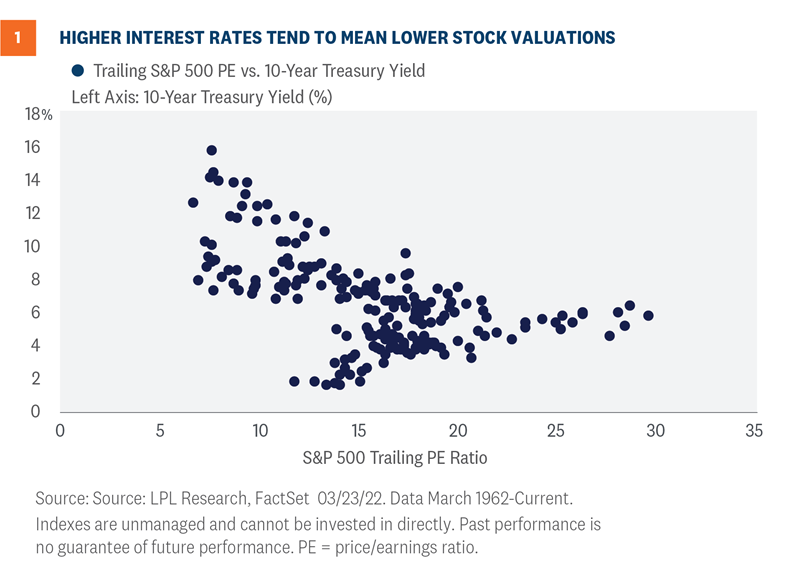
Year to date, the S&P 500 Index P/E based on the consensus earnings estimate for the next 12 months has fallen from nearly 22 down to 19.2 as the 10-year U.S. Treasury yield has risen by about 80 basis points (0.8%) to over 2.4%.
Solid earnings have offset some of the impact of lower valuations, as the consensus estimate for S&P 500 earnings per share in 2022 has risen by about 2% so far this year. But as the economic expansion ages, and given the difficult profit margin environment (wage pressures, supply chain issues, materials and labor shortages, rising commodity prices), big earnings upside will likely be more difficult to achieve. That leaves valuations to do the heavy lifting. If interest rates stay at current levels or rise further, based on the relationship illustrated in [Figure 1], stocks may not get enough valuation support to propel the S&P 500 to 5,000 by yearend.
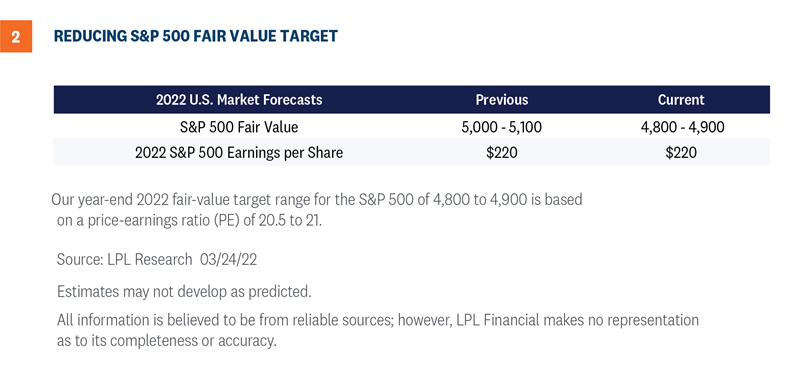
Lowering our S&p 500 fair value target
We see opportunities for stocks to return to record highs later this year on a combination of earnings gains and some recovery in valuations. However, the valuation headwind from higher interest rates may prevent the S&P 500 from clearing 5,000 within the next nine months. So although we continue to recommend investors overweight equities relative to their respective targets, we believe it’s prudent to lower expectations slightly. Our S&P 500 year-end fair value target goes to 4,800 – 4,900, down from 5,000 to 5,100 [Figure 2]. The new target is based on a P/E of 20.5, down from the previous target of 21.5, and our (unchanged) 2023 S&P 500 earnings per share forecast of $235.
Conclusion
Inflation will be the key determining factor as to whether stocks can break through to new highs this year. Inflation rolling over could help bring interest rates down, slow the Fed, and help drive more economic growth and corporate profits. The relationship between inflation and stock valuations is similar to that of inflation and interest rates.
Bottom line, we anticipate a combination of some recovery in valuations, and solid mid-to-high single digit earnings gains from Corporate America will get stocks back to record highs over the next quarter or two. That optimism rests in our belief that interest rates will soon stabilize and inflation will soon peak as earnings grow. But no doubt, the path forward for stocks has gotten tougher. The recent move higher in interest rates doesn’t change the calculus much for us in terms of stocks versus bonds. We continue to recommend an overweight allocation to equities and an underweight fixed income allocation relative to investors’ targets, as appropriate.
Click here to download a PDF of this report.
______________________________________________________________________________________________
IMPORTANT DISCLOSURES
This material is for general information only and is not intended to provide specific advice or recommendations for any individual. There is no assurance that the views or strategies discussed are suitable for all investors or will yield positive outcomes. Investing involves risks including possible loss of principal. Any economic forecasts set forth may not develop as predicted and are subject to change.
References to markets, asset classes, and sectors are generally regarding the corresponding market index. Indexes are unmanaged statistical composites and cannot be invested into directly. Index performance is not indicative of the performance of any investment and does not reflect fees, expenses, or sales charges. All performance referenced is historical and is no guarantee of future results.
Any company names noted herein are for educational purposes only and not an indication of trading intent or a solicitation of their products or services. LPL Financial doesn’t provide research on individual equities.
All information is believed to be from reliable sources; however, LPL Financial makes no representation as to its completeness or accuracy.
U.S. Treasuries may be considered “safe haven” investments but do carry some degree of risk including interest rate, credit, and market risk. Bonds are subject to market and interest rate risk if sold prior to maturity. Bond values will decline as interest rates rise and bonds are subject to availability and change in price.
The Standard & Poor’s 500 Index (S&P500) is a capitalization-weighted index of 500 stocks designed to measure performance of the broad domestic economy through changes in the aggregate market value of 500 stocks representing all major industries.
The PE ratio (price-to-earnings ratio) is a measure of the price paid for a share relative to the annual net income or profit earned by the firm per share. It is a financial ratio used for valuation: a higher PE ratio means that investors are paying more for each unit of net income, so the stock is more expensive compared to one with lower PE ratio.
Earnings per share (EPS) is the portion of a company’s profit allocated to each outstanding share of common stock. EPS serves as an indicator of a company’s profitability. Earnings per share is generally considered to be the single most important variable in determining a share’s price. It is also a major component used to calculate the price-to-earnings valuation ratio.
All index data from FactSet.
This research material has been prepared by LPL Financial LLC.
Securities and advisory services offered through LPL Financial (LPL), a registered investment advisor and broker-dealer (member FINRA/SIPC). Insurance products are offered through LPL or its licensed affiliates. To the extent you are receiving investment advice from a separately registered independent investment advisor that is not an LPL affiliate, please note LPL makes no representation with respect to such entity.
| Not Insured by FDIC/NCUA or Any Other Government Agency | Not Bank/Credit Union Guaranteed | Not Bank/Credit Union Deposits or Obligations | May Lose Value |
RES-1104800-0322 | For Public Use | Tracking # 1-05260488 (Exp. 3/23)