With a Federal Reserve (Fed) meeting, a Bank of Japan (BOJ) meeting, two very important inflation reports, and nearly $120 billion of new Treasury securities auctioned — last week was quite the week for markets. And while the Fed meeting was supposed to get top billing, it turned out the inflation data stole the show. In fact, at least for the Treasury market, it’s been the economic data that has had the largest impact on changing bond prices/yields. But with economic data released daily, that has meant the volatility in the Treasury market has been dizzying lately. So, what should bond investors do during this period of heightened volatility? Keep calm and clip bond coupons.
THE MOST IMPORTANT FED MEETING EVER WASN’T ALL THAT IMPORTANT
Fed meetings have been important drivers of market performance, especially in the Treasury market. Moreover, Fed meetings in which economic and interest rate projections are updated have been, at least historically, even more important meetings. Last week was that meeting. But what was billed as another important Fed meeting turned out largely to be anti-climactic. The economic data that was released before the Fed meeting stole the show (more on that later).
Nonetheless, the Fed held the policy rate unchanged in a range of 5.25–5.50%, where it has remained since July 2023. Further highlights from LPL’s Chief Economist, Jeffrey Roach, include:
- The Federal Open Market Committee (FOMC) revised its view on inflation. No longer without proof, the Committee believes we have seen a modest improvement with inflation.
- Unemployment will likely increase faster than previously reported. The median projection is that unemployment will rise to 4.2% next year, still historically low and based on expectations that the labor market will not materially weaken.
- Inflation pressures will take longer to dissipate, and core inflation will not likely reach the 2% target until 2026.
- Economic growth will slow but remain above the long-run rate for the next couple of years, but this may be too optimistic on the Fed’s part.
ONE AND DONE?
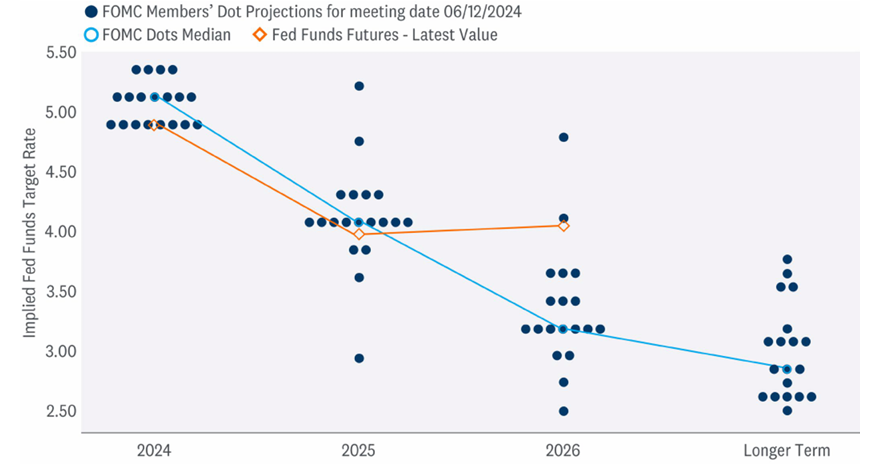
The expected highlight of last week’s Fed meeting was supposed to be the updated interest rate forecast, colloquially known as the dot plot, which is updated four times a year. As a reminder, the dot plot represents the expected path of short-term interest rates by Fed members. Each dot represents a member’s opinion on where the fed funds policy rate should be over the next few years. While not an official policy, it does provide additional transparency into Fed member thinking — albeit anonymously.
Markets were expecting the Fed to pencil in two interest rate cuts this year (down from three last quarter), but the median dot actually reflected only one rate cut this year. However, it was a close call between one or two cuts this year. Eight participants anticipated two cuts, while seven saw only one — and four saw no cuts this year at all.
Also of note, the Committee has started to increase its longer-term “neutral” rate. The neutral rate is largely academic and thought of as the fed funds rate that is neither restrictive nor accommodative. The neutral rate has fallen over the past few decades, but given the resilience of the economy despite higher interest rates, the Fed has started to discuss what that new neutral rate should be, and that rate has started to creep up, at least marginally.
NEW DOT PLOT POINTS TO ONE CUT THIS YEAR; HIGHER “NEUTRAL” RATE

Source: LPL Research, Bloomberg 06/13/24
Past performance is no guarantee of future results. All indexes are unmanaged and can’t be invested in directly.
Regardless, the Treasury market shrugged off the new dot plot and has once again gone back to pricing in two cuts in 2024 (orange line). Part of the reason for the disagreement came hours earlier, when the May Consumer Price Index (CPI) came in slightly better than expected. After a few CPI prints that came in above expectations, the softer reading was a nice surprise for markets. Additionally, despite having the data before the updated economic and interest rate projections were released, it was noted in the press conference that “most” participants chose not to incorporate the new CPI data, which makes the dot plot less hawkish than it appears — and potentially less useful than prior releases.
BOND MARKET VOLATILITY REMAINS ELEVATED
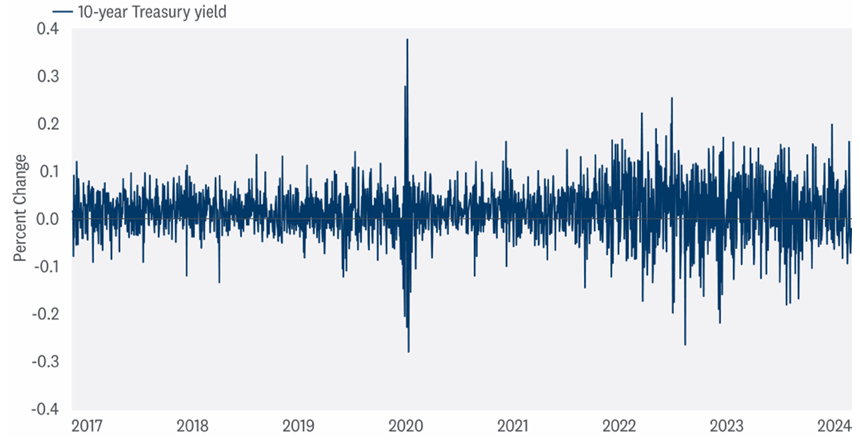
As mentioned, the big event last week was supposed to be the Fed meeting and updated economic and interest rate projections. However, the larger market mover turned out to be a softer CPI release that came out hours before the Fed meeting. Immediately after the release, Treasury yields fell by 0.10% to 0.14%, which essentially served to pull forward an additional expected rate cut into 2024. The fall in yields mostly offset the 0.14% increase in yields that took place after the June 7 jobs report that came in hotter than expected. Earlier that week, yields fell nearly 0.10% in a day after a different economic release (ISM Manufacturing) came in softer than expected. The chart below highlights the daily change in the 10-year Treasury yield, and recently, it isn’t uncommon to see large moves in yields — in either direction.
DAY-TO-DAY VOLATILITY IN THE TREASURY MARKET REMAINS ELEVATED
DAILY CHANGE IN THE 10-YEAR U.S. TREASURY YIELD

Source: LPL Research, Bloomberg 06/13/24
Past performance is no guarantee of future results. All indexes are unmanaged and can’t be invested in directly.
Outside of a real financial crisis, Treasury yields generally don’t move around that much. However, over the past few years, the day-to-day volatility in the Treasury market — the largest and most liquid government bond market in the world — has been dizzying. What was once a staid market, the Treasury market has been a hotbed of volatility of late due to a data-dependent Fed whose reaction function has become anything but clear. The challenge is, without clear forward guidance from the Fed, markets are left to their own interpretation of the data. And with economic data seemingly released daily (according to Bloomberg, there are over 150 economic data releases in June alone) markets have become overly reliant on economic data as well. In fact, according to work from the BlackRock Investment Institute, interest rate sensitivity to economic surprises remains at the highest levels since the Global Financial Crisis. So, what’s an investor supposed to do during this period of heightened volatility?
INCOME OPPORTUNITIES ABOUND (OR KEEP CALM AND CLIP COUPONS)
For many financial markets, the primary driver of total returns comes from price appreciation. You buy a stock, for example, and total returns are largely predicated on the price of that stock going higher. For bonds, it’s different. Most of the time, bonds are bought at or near par and the return component is driven by the income component. In fact, since the inception of the Bloomberg Aggregate Bond Index, over 90% of total returns have come from the income component with the remainder coming from price appreciation. Moreover, using just the near 40-year period of falling interest rates (1981–2017), only about 25% of the annualized returns came from price appreciation, with the overwhelming majority of returns coming from income. So, despite what has been called the great bond bull market due to falling interest rates, it was the high starting coupon rates that were the primary driver of returns.
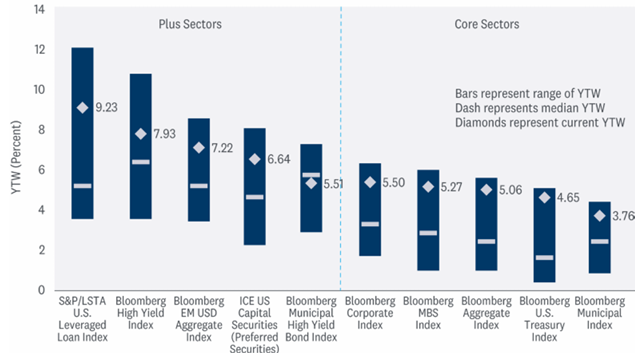
STARTING YIELDS REMAIN ATTRACTIVE RELATIVE TO HISTORY

Source: LPL Research, Bloomberg 06/13/24
And that has implications for today’s fixed income environment. As mentioned, after the back up in bond yields that we’ve seen over the last few years, we’re back to more normal levels. As such, it is unlikely we’re going to see a large decline in bond yields (absent a financial crisis or other “black swan” type event), so total returns for fixed income investors are likely going to be dominated by income. While there remains the optionality of price appreciation, fixed income returns have historically been predicated on income returns and have correlated highly with starting yields. For holding periods as short as five years or as long as 10 years, starting yields have shown to explain approximately 95% of the variation in returns for the index — meaning what you see is what you tend to get. And with starting yields still among the highest levels in decades, the income component within fixed income is as attractive as it’s been in a long time.
Right now, investors can build a high-quality fixed income portfolio of U.S. Treasury securities, AAA-rated Agency mortgage-backed securities (MBS), and short-maturity investment grade corporates that can generate attractive income. Investors don’t have to “reach for yield” anymore by taking on a lot of risk to meet their income needs. And for those investors concerned about still higher yields, laddered portfolios and individual bonds held to maturity are ways to take advantage of these higher yields.
We think the current environment is ripe with income opportunities that, when married with equities, can maintain a portfolio volatility that can be very well tolerated.
CONCLUSION
The move higher in Treasury yields over the past few years has been unrelenting, with intermediate and longer-term Treasury yields bearing the brunt of the more recent moves. The Fed is expected to start reducing interest rates later this year, which should provide relief to fixed income investors. However, with the Treasury yield curve still inverted, it’s possible that we don’t get the kind of reaction from longer-maturity securities that we’ve seen in the past.
The Treasury Department is still expected to issue a lot of Treasury securities to fund budget deficits, and with the BOJ slowly ending its aggressively loose monetary policies in 2024, we could continue to observe upward pressure on yields. However, while supply/demand dynamics can influence prices in the near term, the long-term direction of yields is based on expected Fed policy. That doesn’t mean rates are going to fall dramatically from current levels though, and that is fine for the longer-term prospects for fixed income investors since coupon, and not price appreciation, has historically been the largest component of total returns, regardless of what happens to interest rates in the near term.
ASSET ALLOCATION INSIGHTS
LPL’s Strategic and Tactical Asset Allocation Committee (STAAC) maintains its tactical neutral stance on equities. Steady economic and earnings growth this year has kept the risk-reward trade-off for stocks and bonds fairly well balanced, but moving forward, with valuations for stocks elevated and bonds offering more attractive yields, we believe bonds hold a slight edge over stocks. Strong year-to-date stock market gains may have pulled forward some potential gains from Fed rate cuts, potentially leaving limited upside and more volatility over the balance of 2024 as the economy potentially slows.
Within equities, the STAAC continues to favor a tilt in the Tactical Asset Allocation (TAA) toward domestic over international equities, with a preference for Japan among developed markets, and an underweight position in emerging markets (EM). The Committee recommends a very modest tilt toward the growth style after reducing its overweight position in mid-March, in favor of adding small caps to remove that underweight position. Finally, the STAAC continues to recommend a modest overweight to fixed income, funded from cash.
IMPORTANT DISCLOSURES
This material is for general information only and is not intended to provide specific advice or recommendations for any individual. There is no assurance that the views or strategies discussed are suitable for all investors or will yield positive outcomes. Investing involves risks including possible loss of principal. Any economic forecasts set forth may not develop as predicted and are subject to change.
References to markets, asset classes, and sectors are generally regarding the corresponding market index. Indexes are unmanaged statistical composites and cannot be invested into directly. Index performance is not indicative of the performance of any investment and do not reflect fees, expenses, or sales charges. All performance referenced is historical and is no guarantee of future results.
Any company names noted herein are for educational purposes only and not an indication of trading intent or a solicitation of their products or services. LPL Financial doesn’t provide research on individual equities.
All information is believed to be from reliable sources; however, LPL Financial makes no representation as to its completeness or accuracy.
US Treasuries may be considered “safe haven” investments but do carry some degree of risk including interest rate, credit, and market risk. Bonds are subject to market and interest rate risk if sold prior to maturity. Bond values will decline as interest rates rise and bonds are subject to availability and change in price.
The Standard & Poor’s 500 Index (S&P500) is a capitalization-weighted index of 500 stocks designed to measure performance of the broad domestic economy through changes in the aggregate market value of 500 stocks representing all major industries.
The PE ratio (price-to-earnings ratio) is a measure of the price paid for a share relative to the annual net income or profit earned by the firm per share. It is a financial ratio used for valuation: a higher PE ratio means that investors are paying more for each unit of net income, so the stock is more expensive compared to one with lower PE ratio.
Earnings per share (EPS) is the portion of a company’s profit allocated to each outstanding share of common stock. EPS serves as an indicator of a company’s profitability. Earnings per share is generally considered to be the single most important variable in determining a share’s price. It is also a major component used to calculate the price-to-earnings valuation ratio.
All index data from FactSet.
Value investments can perform differently from the market as a whole. They can remain undervalued by the market for long periods of time.
The prices of small cap stocks are generally more volatile than large cap stocks.
International investing involves special risks such as currency fluctuation and political instability and may not be suitable for all investors. These risks are often heightened for investments in emerging markets.
LPL Financial does not provide investment banking services and does not engage in initial public offerings or merger and acquisition activities.
This research material has been prepared by LPL Financial LLC.
Securities and advisory services offered through LPL Financial (LPL), a registered investment advisor and broker-dealer (member FINRA/SIPC). Insurance products are offered through LPL or its licensed affiliates. To the extent you are receiving investment advice from a separately registered independent investment advisor that is not an LPL affiliate, please note LPL makes no representation with respect to such entity.
Not Insured by FDIC/NCUA or Any Other Government Agency | Not Bank/Credit Union Deposits or Obligations | Not Bank/Credit Union Guaranteed | May Lose Value
RES-0001329-0524 | For Public Use | Tracking # 592144 (Exp. 06/2025)

