
Stocks have been unable to make up much ground since the June 16 lows, with a bear market rally amounting to only around a 4.3% gain in the S&P 500 Index since then (as of July 1). After the more than 6% rally the week of June 24 and the increasing optimism that came with that bounce, stocks pulled back again last week—the 11th down week for the index in the past 13 weeks. While we acknowledge that a V-shaped recovery is probably not in the cards and prior valuation targets no longer appear achievable, we remain constructive on equities for the second half, but not complacent.
Not out of the woods but some encouraging signs
Clearly markets do not yet believe we’re out of the woods as debates about whether inflation has peaked continue while the Federal Reserve (Fed) stands ready to aggressively hike its target interest rate over the next few months (at least) while shrinking its bloated balance sheet.
But there have been some encouraging signs lately:
- Oil prices are down over 10% since June 8, which will likely translate into lower prices at the pump in the near term.
- The inflation rate implied by Treasury Inflation-Protected Securities (TIPS) over the next five years has fallen from 3.1% to 2.6% over the past month and down from the peak of 3.7% earlier this year.
- The University of Michigan survey of consumers’ long-term inflation expectations fell from 3.3% to 3.1%.
- The latest data on supply chains from the New York Fed indicate supply bottlenecks are easing.
Also, consider the evidence that consumers are in pretty good shape overall heading into the latest inflation surge:
- At 3.8%, the unemployment rate is reaching 50-year lows, while wages are up more than 5% over year-ago levels, according to the latest Bureau of Labor Statistics data. While that worries the Fed, it puts consumers in a better position to weather this storm. Also, consider there are over 11 million job openings in the U.S. compared with 6 million unemployed people.
- U.S. households held $3.2 trillion more in checkable deposits on March 31, 2022 than at the end of 2019 before the pandemic. Money market assets are also nearly $1 trillion above December 2019 levels.
- The financial obligations ratio was 14.2% as of March 31, 2022, below the pre-pandemic lows going back to 1980. Consumers’ discretionary incomes in aggregate are nicely covering debt obligations (mortgages, car loans, home equity loans, etc.).
Risks are clear
Just because consumers have some things going for them doesn’t mean the surge in inflation isn’t painful, nor does it necessarily mean the U.S. economy will avoid recession. LPL Research places 50% odds of a recession within the next 18 months, so we’re not discounting that probability. The Fed’s spotty track record of fighting inflation without causing a recession does little to instill confidence.
The good news is that if the economy does contract to the point where it is officially labeled a recession (the National Bureau of Labor Statistics makes that call), the impact will likely be muted somewhat by the strong financial position enjoyed by consumers heading into it. Keep in mind that two straight negative GDP quarters is not sufficient to “qualify” for a recession. NBER’s broader definition will likely enable the economy to avoid recession in the first half regardless, though GDP may eke out a small gain anyway.
Other risks to keep an eye on include another possible spike in energy prices, which could push interest rates higher and weigh on the economy and stock valuations. Geopolitical tensions could escalate in Europe at any time (though we could also get a surprise resolution/cease-fire). Finally, the longer that inflation remains stubbornly high, the more aggressive the Fed will get with rate hikes, increasing the odds of a recession. Some components of inflation such as housing and wages will be very hard to bring down, and inflation can become entrenched the longer it lingers and potentially gets embedded in consumer expectations.
So what is this market worth?
Valuing stocks during periods of high uncertainty is tricky. On the upside, we think stocks may be worth more than 20 times earnings in a return to an environment of low inflation and low and stable interest rates. We’ll probably get there eventually, but that’s very unlikely to occur this year. Interest rates have only come down because of recession fears, while inflation will still be elevated—even if somewhat lower—when the calendar turns to 2023 (unfortunately). So a P/E over 20 is probably too rich. Remember stock valuations are inversely correlated to inflation and interest rates.
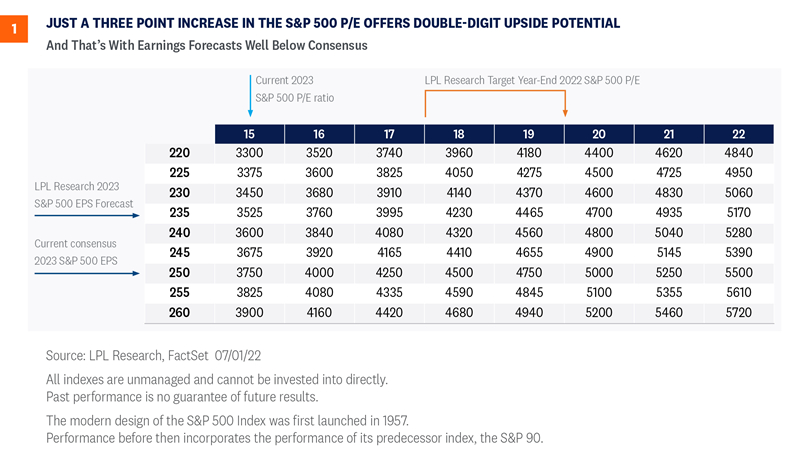
On the opposite end of the spectrum, we know stocks have traded down to an average of around 13 times earnings during the lows of the past three bear markets. But our belief is that this economic and profit environment is better than in the early 1990s, early 2000s, or 2008-2009 and therefore supports higher valuations. Add to that our expectation that inflation will soon begin a steady march lower and that late-cycle valuations in the 18-19 range have been commonplace in recent decades. As a result, we believe a price-to-earnings ratio of 18-19 on 2023 S&P 500 earnings estimates is reasonable. As shown in Figure 1, a return to that multiple translates into potential double-digit returns for stocks over the rest of the year assuming earnings come through as we anticipated.
Don’t forget that what matters to consumers also matters to politicians. President Biden’s approval rating has continued to decline amid higher inflation numbers, with a near perfect inverse correlation to gas prices. That has implications for the midterm elections, where Republicans will look to capitalize on inflation and spin their energy policies as the solution. Currently, betting markets show about 3:1 odds that Republicans will be able to take control of both the House of Representatives and the Senate in November.
Energy policy remains a wild card
To be sure, the Biden administration, while focused squarely on its policy of transitioning the economy towards a non-fossil fuel environment, has been trying to alleviate the burden of rising gasoline and diesel prices by trying to introduce a federal gasoline tax holiday.
The administration wants the federal tax holiday, which would take 18.4 cents off a gallon of gasoline, to be introduced along with a state tax holiday. A tax break from both state and federal governments is expected to give consumers approximately $30 of savings per month for one weekly fill-up. The breakdown in savings comes from the 18.4 cents per gallon for the federal tax and 31 cents per gallon on average from state governments. The tax holiday, which would last for three months, needs congressional approval, and so far, despite intense lobbying efforts, approval doesn’t appear forthcoming.
In addition, the administration has become increasingly vocal in encouraging energy companies to increase drilling, while an upcoming presidential visit to Saudi Arabia is being highlighted as an opportunity to discuss measures to foster peace in the Middle East. Still, given that Saudi Arabia is the de facto leader of OPEC, the goals of the visit undoubtedly include an attempt to return with an agreement for higher oil production levels. OPEC, despite raising production levels in July and August, is seemingly intent on keeping prices high as member countries recover from the drought of demand incurred by the pandemic.
Ironically, although lower gasoline prices could encourage more consumer discretionary spending, it could also lead to more travel by car, exactly the opposite of what’s needed to help bring down inflation. A long-term solution still remains unclear, as the low oil price environment that has reigned over much of the past eight years has consistently punished American oil companies for investment and rewarded more shareholder-friendly policies such as dividends and share buybacks. Still, the all-important U.S. consumer needs a break regardless of how it’s delivered.
Energy prices drive inflation expectations
Nothing we have addressed so far is especially positive, so let’s get to that part. While the gasoline prices shown in Figure 1 are just pennies removed from those all-time highs, gas prices at the pump tend to operate on a lag from real world commodity prices. In the past few weeks, the price of West Texas Intermediate (WTI) crude oil has fallen approximately 15%, losing a technical support level we believed would hold near $115/barrel.
While the trend in most energy/oil prices is still higher from a long-term perspective, numerous other commodities that have experienced strong bullish runs appear to be more clearly breaking down, so the odds of a top in oil prices may be higher than just the chart itself suggests. As global central banks fight inflationary pressures around the globe with rate hikes, the result has been a perception that the economy will not be able to withstand continued tightening of financial conditions and will fall into a marked slowdown, if not an all-out recession. For instance copper, often referred to as Dr. Copper for its ability to forecast economic conditions, just hit its lowest level since February 2021.
That in and of itself isn’t a positive, but as shown in Figure 2, market-based inflation expectations are highly correlated with commodities, especially oil, and those also appear to be rolling over recently, with the two-year breakeven implied inflation rate recently hitting its lowest level in four months.
Conclusion
The risk-reward for stocks looks favorable to us at current levels based on what we see as more potential upside than downside. The average non-recessionary bear market decline has been about 24%, roughly in line with the most recent peak-to-trough decline. But for the double-digit percent upside to be realized by year-end, inflation has to start coming down soon, helping boost the economy on the back of consumers.
History appears be on the market’s side, as the S&P 500 could be poised for solid gains ahead:
- After the worst two-quarter performances in history, where the S&P 500 has dropped more than 20%, it has gained back over 21% on average in next half-year, and over 31% on average a full year out.
- The average gain off of midterm election lows, which may have been set in June, has been over 30%.
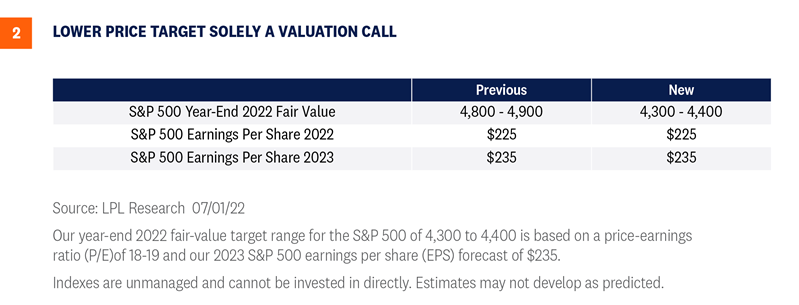
Despite our still constructive—not complacent—stance, stocks warrant lower valuations based on higher interest rates and troublesome inflation picture. Our revised year-end 2022 fair value S&P 500 target of 4,300-4,400 is still more than 12% above the July 1 closing price at the low end, but is 10% below our prior target. We still expect a growing economy and solid earnings gains in the second half to fuel higher stock prices, though gains will likely be back-end loaded given the time it will take for inflation to come down enough for the Fed to signal a pause.
We continue to recommend an overweight allocation to equities and underweight to fixed income relative to investors’ targets, as appropriate. For more risk-tolerant investors or investors with neutral positioning, we would consider increasing equity allocations slightly, as the LPL Research Strategic and Tactical Asset Allocation Committee (STAAC) has done in July as more evidence that the market’s bottoming process is progressing has emerged.
Click here to download a PDF of this report.
IMPORTANT DISCLOSURES
This material is for general information only and is not intended to provide specific advice or recommendations for any individual. There is no assurance that the views or strategies discussed are suitable for all investors or will yield positive outcomes. Investing involves risks including possible loss of principal. Any economic forecasts set forth may not develop as predicted and are subject to change.
References to markets, asset classes, and sectors are generally regarding the corresponding market index. Indexes are unmanaged statistical composites and cannot be invested into directly. Index performance is not indicative of the performance of any investment and does not reflect fees, expenses, or sales charges. All performance referenced is historical and is no guarantee of future results.
Any company names noted herein are for educational purposes only and not an indication of trading intent or a solicitation of their products or services. LPL Financial doesn’t provide research on individual equities.
All information is believed to be from reliable sources; however, LPL Financial makes no representation as to its completeness or accuracy.
U.S. Treasuries may be considered “safe haven” investments but do carry some degree of risk including interest rate, credit, and market risk. Bonds are subject to market and interest rate risk if sold prior to maturity. Bond values will decline as interest rates rise and bonds are subject to availability and change in price.
The Standard & Poor’s 500 Index (S&P500) is a capitalization-weighted index of 500 stocks designed to measure performance of the broad domestic economy through changes in the aggregate market value of 500 stocks representing all major industries.
The PE ratio (price-to-earnings ratio) is a measure of the price paid for a share relative to the annual net income or profit earned by the firm per share. It is a financial ratio used for valuation: a higher PE ratio means that investors are paying more for each unit of net income, so the stock is more expensive compared to one with lower PE ratio.
Earnings per share (EPS) is the portion of a company’s profit allocated to each outstanding share of common stock. EPS serves as an indicator of a company’s profitability. Earnings per share is generally considered to be the single most important variable in determining a share’s price. It is also a major component used to calculate the price-to-earnings valuation ratio.
All index data from FactSet.
This research material has been prepared by LPL Financial LLC.
Securities and advisory services offered through LPL Financial (LPL), a registered inv estment advisor and broker -dealer (member FINRA/SIPC). Insurance products are offered through LPL or its licensed affiliates. To the extent you are receiving investment a dvice from a separately registered independent investment advisor that is not an LPL affiliate, please note LPL makes no representation with respect to such entity.
| Not Insured by FDIC/NCUA or Any Other Government Agency | Not Bank/Credit Union Guaranteed | Not Bank/Credit Union Deposits or Obligations | May Lose Value |
RES-1206450-0622 | For Public Use | Tracking # 1-05300438 (Exp. 07/23)